‘A Huge Sandbox’
How Computational Tools Can Guide Us Through a Pandemic

There’s a flood of epidemiological data pouring in daily on Covid-19. The challenge is figuring out how to integrate this deluge of data with all its variables into a useable format. That’s where statistical modeling and machine learning come in.
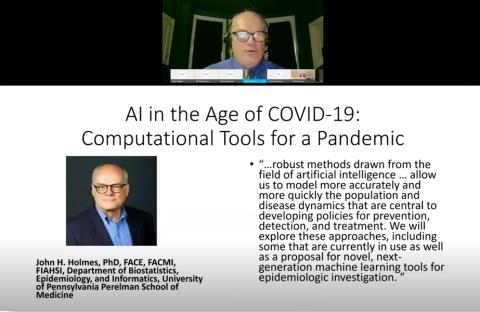
“There’s a huge sandbox with regard to how much data we’ve got and how much is being produced daily,” said Dr. John Holmes, professor and associate director, Institute for Biomedical Informatics, University of Pennsylvania Perelman School of Medicine. “Computational methods are being rethought and re-engineered and new ones are being introduced [all the time].”
Holmes, who spoke virtually at NLM’s inaugural Ada Lovelace computational health lecture on June 24, had returned days earlier from a 6-month sabbatical in Italy. He discussed how different data models help us analyze contagion and predict outcomes, which can guide research and policy.

Photo: John Holmes
Italy, where Holmes was a visiting professor at the University of Pavia in Lombardy, had the world’s highest Covid-19 mortality rate during the first months of the pandemic. A confluence of environmental and demographic factors contributed to the country’s dire numbers, from muggy weather and pollution to an aging population, many of whom live in nursing homes that have become hotbeds of infection.
The densely populated region of Lombardy was the hardest hit. On Mar. 9, the entire country went into lockdown. “I knew enough about this at that point to realize that we’re in big trouble and I’m not going home,” said Holmes.
Contagion Dynamics
Data models are handy tools for managing all the moving parts of an evolving pandemic, providing a window into contagion dynamics. “This is really important because a pandemic occurs over time,” said Holmes, and the dynamics “give us a sense for the rate of spread and identify co-variance. And, from all of this, we want to develop and evaluate methods for containment and mitigation.”
Traditional computational methods—such as epidemic curves that plot the number of cases along a timeline—track disease transmission and identify hot-spots. These curves rely on reporting, which can be spotty and delayed, noted Holmes, but they do paint a useful picture of contagion dynamics.
“The early exponential rise in these curves indicates the point in time where the strain on existing health care systems is the highest,” he said. Some countries did a better job than others of flattening the curve, spreading cases over time to reduce the burden on hospitals.
Other tools, including compartment models such as the SEIR—susceptible, exposed, infected and recovered—chart how people progress through each “compartment,” information that can be used to simulate the effects of the pandemic on hospital capacity. These models can give us rate equations, such as the reproduction number, or R-naught, representing the average number of people each person infects during an outbreak.

Photo: John Holmes
The day before Holmes’s lecture, Italy reported only 122 Covid-19 cases over a 24-hour period. “The R-naught for Italy right now is far less than 1; the infection is dying out,” he said. “That’s very exciting, to say the least, given that the case count was typically in the thousands daily for months.”
Some statistical models have had mixed track records. The better ones, said Holmes, consider multiple elements, such as a model his colleagues have been working on with the Policy Lab at Children’s Hospital of Philadelphia that incorporates census data, behavioral risk surveys and environmental factors.
“There’s no better example of a dynamical system than a pandemic like covid,” said Holmes. “There’s a certain underlying chaotic function.”
Artificial Intelligence
Other computational tools use machine learning to mine epidemiological data and predict outcomes. Setting confirmed covid cases as the outcome, a group of researchers used computer-generated algorithms to examine the impact of environmental factors on covid transmission in four cities in Italy.

“These methods came up with population density and humidity being the strongest predictors of Covid-19 spread,” said Holmes. “I’ve heard humidity come up time and again, in a number of different covid projects that I’ve been working on.”
Another study simulated parameters intended for contact tracers and decision-makers who need such real-time assessments. Researchers used a feature map plugged into past mobile crowd-sensing data to model mobility patterns.
“They found that 2 weeks after the first confirmed case in the city under the risk of community spread, AI-enabled mobilization of assessment centers can [dramatically] reduce the unassessed population size,” said Holmes. This became a useful tool for updating policy guidelines.
Another predictive approach is looking at what’s trending online. Internet search behavior can serve as an early-warning system for incidence of covid or other infectious diseases, said Holmes, who noted exponential increases in online searches for handwashing, hand sanitizer and antiseptics early in the pandemic.
Social media can also compute incidence early on. In China, the Wiebo social media platform aggregated and compared 15 million covid-related posts across the country. Reports of symptoms and diagnosis of cases significantly predicted the daily case counts compared with official statistics, noted Holmes.

Photo: National Portrait Gallery, London
Beyond case counts, a more varied picture can come from agent-based models, which simulate behaviors, allowing researchers to see the potential effects as they tweak the parameters individually or combined with other agents.
Researchers recently modeled infection spread in nursing homes in Italy by setting up risk parameters using a new, multi-agent platform called NetLogo. “They found useful information and strategies for reducing transmission risks,” said Holmes. With this model, “you can certainly implement some interventions, perhaps masking or no-visitation policy in the nursing home…and see how much that would reduce cases.”
The question remains: how can we best use the abundance of data now available to researchers?
“Hopefully,” said Holmes, “it feeds into policy and behavior change, and a reduction in the impact of a pandemic like this in the future.”
