Investigators Develop Resources to Understand Temperature Exposures


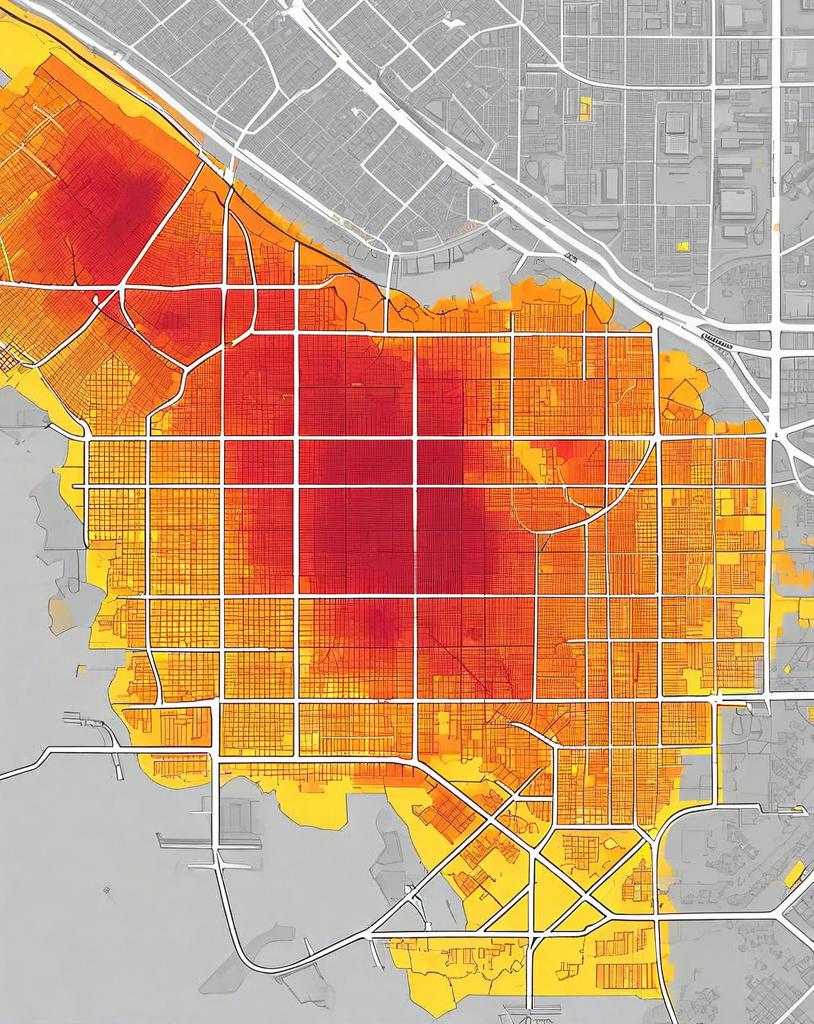
Photo: Shutterstock
A new model for tracking temperatures demonstrates how research conducted by NIH’s National Institute of Environmental Health Sciences (NIEHS) directly benefits communities.
Using a network of personal weather stations already collecting real-time data, scientists from NIEHS’s Division of Translational Toxicology (DTT) developed a model that precisely maps temperatures in city neighborhoods. This capability will help researchers better understand the relationship between extreme heat and health outcomes, and support efforts to reduce heat-related risks.
“This work provides an innovative platform for understanding how weather-related stressors and other environmental factors interact to affect human well-being,” said DTT Scientific Director Dr. Heather Patisaul.
A collaborative approach
The project unites specialists from different research backgrounds to devise innovative methods and solutions. Dr. Kyle Messier, who leads the Spatiotemporal Exposures and Toxicology Group at NIEHS, specializes in developing geospatial models that show how environmental factors influence health across regions and over time. Although he primarily focuses on chemical exposures, he teamed up with Dr. Eva Marquès, a recent postdoctoral fellow at NIEHS, to develop heat models for U.S. cities.
“It seemed like a natural step because we take an exposomics approach to research,” Messier said. “We work to understand how exposure to everything under the sun affects health over a lifetime.”
Practical applications
Messier and Marquès collected hourly readings of air temperature from weather-monitoring stations embedded in neighborhoods in New York, Philadelphia, Phoenix and Raleigh-Durham, NC. Their model mapped temperature variations across time and space, identifying urban heat islands—areas where city landscapes amplify heat compared with surrounding regions.
Messier noted that the model complements ongoing efforts, such as NIH’s All of Us Research Program and the Personalized Environment and Genes Study. Both initiatives compile large datasets toward understanding how environmental factors, lifestyle and genetics interact to influence health. Integrating temperature data will allow researchers to better evaluate the role of heat stress over time and guide public health strategies.
“Our approach reveals hotspots where attention is needed,” said Marquès. “The data can support actions like heat awareness campaigns, guide construction methods and park development, and inform other strategies to improve the urban environment and reduce health risks.”
Spreading the benefits
Messier and Marquès prioritized making their data accessible and reproducible.
“We’ve put a lot of effort into ensuring it can be run and integrated into other studies,” said Messier. “It’s tested, documented and accessible for other scientists and analysts to make their own calculations.”
The team made predictions for the largest 100 U.S. urban areas, which is publicly available at the Harvard Dataverse:
bit.ly/4s9XSqL
Marquès hopes other scientists will use the model to understand health effects—ranging from sleep discomfort to severe disease—of urban heat islands.